Loading...
Data Analytics & BI LinkedIn Profile

About Me

I help organizations understand the story behind the numbers

I am a data-focused professional with experience in business intelligence, reporting, and performance analytics. I turn complex data into simple decisions through dashboards, KPI tracking, and process optimization.

Dashboard Design

Interactive visuals built for leaders and decision-makers.

Performance Analysis

Tracking growth, opportunities, and operational efficiency.

Portrait of Eslam Azmy, Data Analyst and BI Developer
Business questions first. Data in context.

Core Services

From raw data to business-ready insight

I combine analytical thinking and practical business needs to build smarter reporting, clearer dashboards, and more confident decision-making.

Sample Power BI dashboard visual
Power BI Dashboard

Executive-ready reporting that helps teams track KPIs, trends, and business health with clarity.

Request this service
Sample Excel analysis visual
Excel Automation

Streamlined spreadsheets, formulas, and recurring reporting workflows that save time and reduce errors.

Request this service
Sample operations analytics visual
KPI Tracking

Useful metric frameworks to measure business performance and highlight the next best action.

Request this service
Sample trend analysis dashboard visual
Trend Analysis

Structured analytical reviews to detect business opportunities, risks, and changing patterns early.

Request this service
Sample reporting workflow visual
Reporting Systems

Clear reporting processes for recurring updates, operational visibility, and leadership reviews.

Request this service
Sample decision support analytics visual
Decision Support

Business-focused insights that help leaders move faster with more confidence and clarity.

Request this service

Portfolio

Selected work and insight stories

Examples of executive dashboards, performance reporting, and data storytelling built to support smarter business decisions.
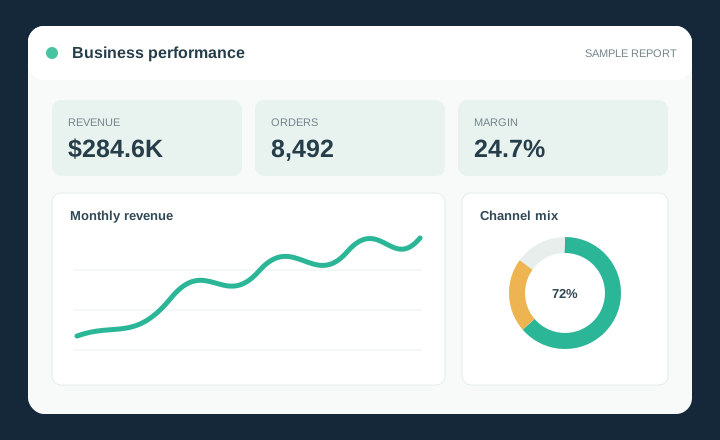
Illustrated executive KPI dashboard concept
Concept Case Study

Leadership KPI Overview

A sample Power BI concept showing how leadership could monitor revenue, targets, and monthly movement in one view.

Eslam Azmy

Power BI · DAX
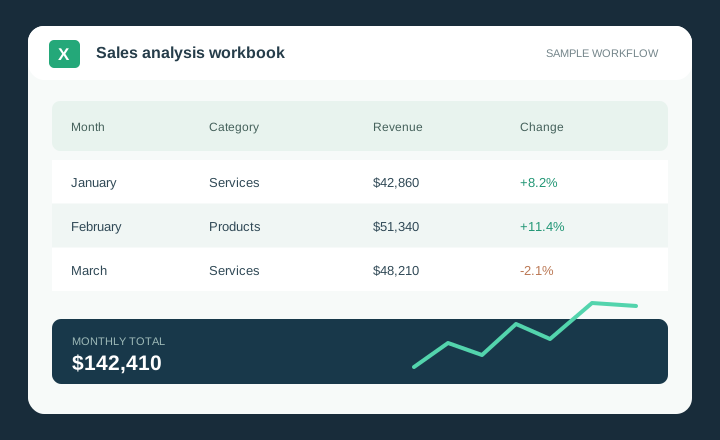
Illustrated Excel sales analysis concept
Concept Case Study

Sales Performance Analysis

A sample Excel analysis concept with category comparisons, monthly trends, and a concise view of performance drivers.

Eslam Azmy

Excel · Power Query
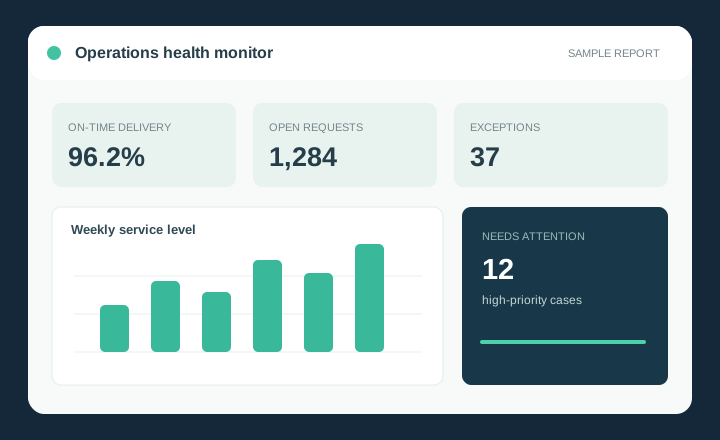
Illustrated operational analytics concept
Concept Case Study

Operations Health Monitor

A sample dashboard concept for service levels, workload, and operational exceptions with drill-down paths for investigation.

Eslam Azmy

Power BI · Data Modeling

Illustrated reporting automation concept
Concept Case Study

Recurring Report Workflow

A sample Excel and Power Query workflow concept for repeatable cleanup, validation, and monthly reporting.

Eslam Azmy

Excel · Power Query
Tools & Expertise

The stack behind every insight

A practical analytics toolkit focused on business intelligence, reporting, automation, and decision support.

Power BI dashboard illustration

Power BI

Dashboards

Excel analytics illustration

Excel

Automation

Data modeling illustration

SQL

Data Modeling

KPI analytics illustration

DAX

Metrics